

NF ACOUS Sound Dashboard Manual
Six foundational dimensions for a fuller language of soundthat is easier to understand and compare
People use different words to describe sound. Listening to the same passage of music, the same audio processing or the same headphones, one person may call the sound warm while another calls it full-bodied. One may hear transparency, while another simply hears more treble. The problem is not that these words are unusable, but that they often lack a shared reference, making them difficult to understand and compare consistently.
When evaluating playback products such as headphones and loudspeakers, judging sound solely by a frequency response curve gives a limited view. A single curve cannot convey the full listening experience. Frequency response curves help us examine the relative energy at different frequencies and are important tools for product development and consistency control. Primarily, however, they describe how sound is distributed across frequency. On their own, they do not explain dynamics and transient response, spatial presentation, the relationships between different sounds or the ability to reveal fine detail.
A target curve is also not a single, universal standard that applies independently of context. It should be adapted to the actual listening task and use case, helping users perceive audio information more quickly and accurately.
NF ACOUS developed its sound description system, and presents it through the Sound Dashboard, to turn abstract listening impressions into a language of sound that people can perceive, understand and compare. The system comprises six foundational dimensions: frequency profile, dynamics, transient response, soundstage, separation and resolution—the amount of audible information. Together, they form a sonic profile that describes the sound’s tonal emphasis and how it rises and falls, extends through space, keeps sounds organized and reveals detail.
The Sound Dashboard is a tool for structured, subjective descriptions of auditory experience. It can describe a passage of sound, the result of audio processing or a playback system. It can also describe a listener’s requirements and preferences.
When creating a dashboard for a specific audio product, objective data provide a measurable reference, while subjective listening impressions summarize the audible presentation. Both contribute to the final profile. When discussing sound requirements or recording personal listening impressions and preferences, users can also work directly from subjective listening, using the same six dimensions to document, describe and communicate what they hear. They do not need to take objective measurements first.
The dashboard is therefore more than a specification sheet designed only for headphones. It is a method of describing sound in a structured way. Headphone sound depends strongly on subjective perception and is difficult to capture fully in a single curve, making headphones one particularly suitable application.
Understanding sound through a display system analogy
The six dimensions become easier to understand if we compare the final presentation of a passage of sound, an audio process or a playback system with the image produced by a display. Frequency profile is analogous to color and tonal balance. Dynamics resemble the range and gradation between light and dark in HDR. Transient response is comparable to a display’s response speed. Soundstage describes the spatial scale and near–far relationships specific to sound. Separation resembles the contrast and preservation of boundaries between neighboring objects in a complex image. Resolution concerns the amount of perceptible detail, much as display resolution does. This analogy is only an aid to understanding; it does not imply that audio and display specifications can be directly converted into one another.
Why these six dimensions
Shaping sound commonly involves four main types of processing.
Frequency processing changes the relative balance between frequency bands, affecting tonal emphasis, body, brightness and the sense of extension.
Dynamics processing changes level relationships and the sound’s envelope, affecting its rise and fall, impact and tension.
Time-based processing changes delay, reverberation and the way sound develops over time, affecting space, distance and the connections between sounds.
Harmonic processing changes overtone structure and nonlinear components, affecting body, brightness, roughness and texture.
These four mechanisms do not map directly onto the six dimensions. Compression, for example, may affect both dynamics and transient response; time-based processing may affect both soundstage and separation; and harmonic structure can alter the sense of body, brightness and detail. The six dimensions describe the results people ultimately hear, rather than treating sound as a simple stack of effects. They were chosen primarily to address six basic questions that arise when people listen to, create, compare and discuss sound. The four types of processing offer a reference for understanding how these audible results are formed and changed. They are neither a one-to-one mapping nor an exhaustive account of every acoustic mechanism.
How to read the Sound Dashboard
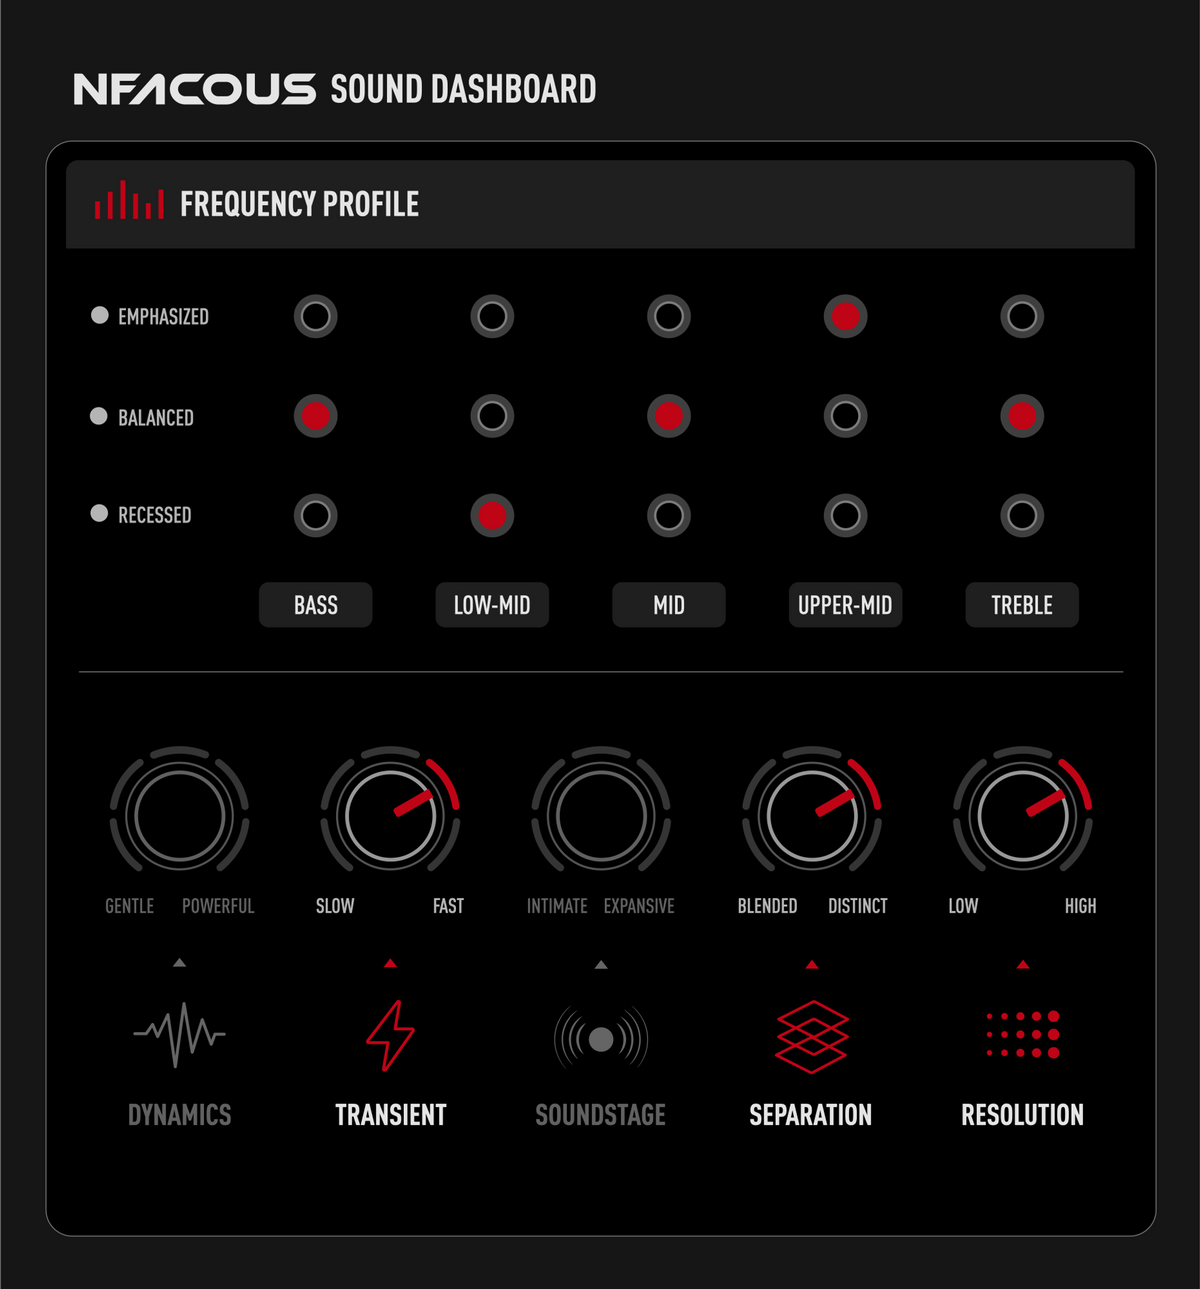
A complete Sound Dashboard uses a “1 + 5” structure: one frequency profile, followed by five sound characteristics—dynamics, transient response, soundstage, separation and resolution. The frequency profile identifies the overall tonal emphasis. The other five characteristics describe how sound rises and falls, extends through space, keeps sounds organized and reveals information. These are descriptions of sonic characteristics, not an overall sound quality score

One frequency profile and five sound characteristics together form a sonic profile.
Start by checking which regions, from bass to treble, are relatively emphasized, balanced or recessed. This establishes the overall tonal emphasis. Then read the five sound characteristics in order to understand the sound’s behavior, space, organization and detail. The dot and dial positions indicate different directions; they should not be read simply as “higher is better” or “farther right is better.”
Frequency Profile
Frequency profile describes how prominent each frequency band is within the overall listening impression.
This system divides the audible frequency range into five regions for observation. The divisions support consistent description and comparison, and summarize working regions commonly used in mixing and critical listening. Sound varies continuously across frequency: these boundaries do not imply an abrupt perceptual change at a particular frequency. They are not the only possible band divisions used in audio, and they must not be interpreted as headphone crossover frequencies.

The dots show each band’s relative position in the overall listening impression, not a specific decibel value. The middle position, “Balanced,” refers to perceptual balance: under consistent listening conditions, the band sits naturally within the whole, neither clearly emphasized nor clearly recessed. Perceptual balance does not mean a perfectly flat measured response curve; it is a relative balance in what we hear.
Bass (20–250 Hz): Listen primarily for low-frequency extension, weight, the sense of vibration and the overall bass foundation.
Low-mid (250–800 Hz): Listen primarily for body, fullness and warmth. Excess energy here may sound muddy or boxy.
Mid (800 Hz–2 kHz): Listen primarily for the presence of vocals and the main body of most instruments, and whether they sound more forward or relatively recessed.
Upper-mid (2–6 kHz): Listen primarily for definition, clarity, presence and edge.
Treble (6–20 kHz): Listen primarily for brightness, air, extension and the definition of high-frequency detail.
The three dot positions describe relative listening impressions. They do not correspond to specific dB values and cannot be mechanically derived from a frequency response curve. To understand objective performance, also consult measurements such as frequency response, distortion, impedance and sensitivity.
Five sound characteristics and how sound unfold

The endpoints of the five dials indicate different sonic directions, not better or worse quality.
Dynamics
Dynamics describe the extent and impact of changes between soft and loud sounds. Listen for natural contrast between quiet and loud passages, clear differences between accented and softer notes, and a sense of tension and freedom in large musical swings. Dynamics concern changes in level, not simply how loud the playback is.
Transient Response
Transient response describes how quickly sound responds at its onset and as it dies away. Listen for crisp drum attacks, clearly defined plucked strings and controlled endings when sounds stop. Faster transient response generally sounds cleaner and tighter; slower response sounds more rounded, and may become sluggish or blurred if it is too slow. This dimension concerns the speed of response to changes in sound, not the tempo of the music.
Soundstage
Soundstage describes the overall extent of the perceived acoustic space. Listen for its horizontal and vertical spread, its near–far relationships, whether the music feels open and spacious, how much distance separates sounds, and whether vocals and instruments occupy clearly differentiated positions from front to back.
Separation
Separation describes how well contrast is preserved between different sounds. Listen for whether simultaneous vocals and instruments retain their own outlines and positions, allowing each to be identified and followed independently. When separation is limited, sounds tend to mask one another, pile up or blend together.
Resolution
Resolution describes the amount of audible information that can be perceived and identified. Listen for a singer’s breath, instrumental texture, the contours of overtones, reverberation tails and subtle changes. Resolution means being able to perceive these clearly, rather than simply hearing more treble or a brighter sound.
Soundstage, separation and resolution answer three different questions. Soundstage concerns the size of the perceived space. Separation concerns how easily different sounds can be distinguished. Resolution concerns how readily fine detail can be perceived. They influence one another, but they are not interchangeable.
Understanding composite listening descriptors
In everyday conversation, we often describe sound as warm, transparent, crisp or constrained. This system calls these composite listening descriptors. They are not additional dimensions outside the six-dimension system; they are overall impressions produced by combinations of the foundational dimensions.
To keep the language consistent, these descriptors are explained only through the six foundational dimensions and their established positions. No additional dimensions of judgment are introduced. The combinations below illustrate common tendencies; they are not fixed formulas for each word.
Warm
Warm = Frequency profile: relatively emphasized low-mid, with balanced or relatively recessed upper-mid. Transient response: at the middle position or toward Slow.
If the low-mid becomes more prominent, the upper-mid and treble become more recessed, or transient response becomes slower, the overall impression may also change. Warmth therefore cannot be reduced to adding more bass.
Transparent
Transparent = Frequency profile: balanced or relatively recessed low-mid, with balanced upper-mid and treble. Separation: toward Distinct. Resolution: toward High.
Simply emphasizing treble does not establish transparency if separation remains toward Blended and resolution remains low.
Crisp and punchy
Crisp and punchy = Dynamics: toward Powerful. Transient response: toward Fast. Frequency profile: balanced or relatively emphasized bass.
If dynamics tend toward Gentle or transient response tends toward Slow, relatively emphasized bass alone may not produce a crisp, punchy overall impression.
Constrained and lacking openness
Constrained and lacking openness = Dynamics: toward Gentle. Soundstage: toward Intimate. Separation: toward Blended.
Here, “lacking openness” is simply an everyday listening description. It does not directly mean that the source equipment or amplifier has insufficient power to drive the headphones. The headphones’ own combination of dynamics, soundstage and separation can produce a similar impression.
These combinations illustrate common tendencies, not fixed formulas. The same word can arise from different combinations of positions across the six dimensions. The same set of positions may also produce different impressions with different recordings, playback levels and fitting conditions. Composite descriptors are useful summaries, but they cannot replace the six foundational dimensions.
When you encounter a new listening descriptor, consider six questions in order: Where is the tonal emphasis? Is there sufficient contrast between soft and loud sounds? Are attacks and endings fast or slow? Is the perceived space intimate or expansive? Are different sounds easy to distinguish? Is fine detail easy to perceive?
Considering these six aspects together helps you understand the basis of other descriptors, such as clear, full-bodied, relaxed, sharp, crowded and clean, and gradually build your own listening vocabulary.
The six-dimension system does not prescribe how everyone should listen. It offers a shared method of observation. By repeatedly comparing familiar music under relatively stable listening conditions, descriptions that once seemed vague and subjective can become clearer, more specific and easier to communicate.
Reading a complete dashboard

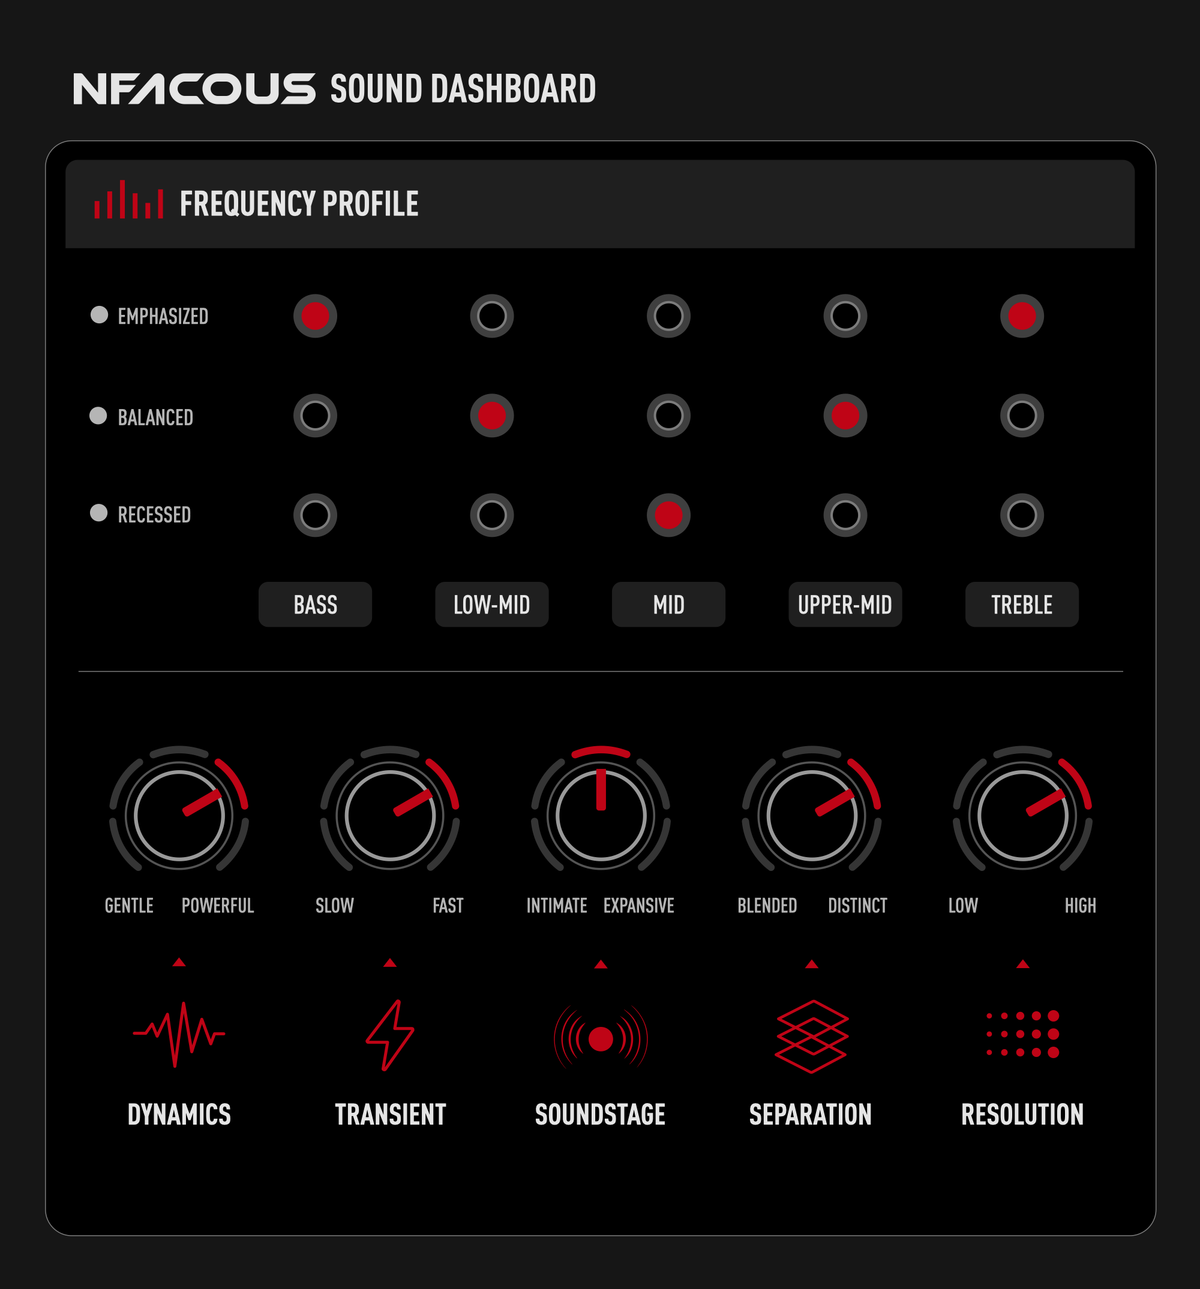
This illustration demonstrates how to read the dashboard. It does not represent a specific product.
Step 1: Read the frequency profile. Identify the relatively emphasized, balanced and recessed regions to establish the tonal emphasis.
Step 2: Read the five dials in order: changes between soft and loud, the speed of attacks and endings, spatial extent, the distinction between sounds and the presentation of detail.
Step 3: Combine all six results into a complete description. Do not let a single dot or dial stand in for the whole profile.
The example on this page can be read as follows: bass and treble are relatively emphasized; low-mid and upper-mid are balanced; and mid is relatively recessed. Dynamics lean toward Powerful, transient response toward Fast, soundstage sits at the middle position, separation leans toward Distinct and resolution toward High.
Finally, return to the actual use case and relate the profile to the sound, task and listening conditions. When comparing headphones, keep the fit consistent. Similar profiles may indicate similar tendencies, but they do not mean that the actual sound is identical.
Making meaningful comparisons
When comparing sound options, processing results or playback products, use the same familiar passage of music, similar playback levels and short switching intervals wherever possible. For headphones, also maintain a consistent fit and use the same ear tips. A slightly louder presentation can often be mistaken for greater clarity or stronger dynamics, so closely matching playback levels is important.
The Sound Dashboard cannot replace objective measurements such as frequency response, distortion, impedance and sensitivity. A single diagram cannot reveal every sonic attribute of what it describes, nor every electroacoustic property of an audio product. Frequency emphasis or recession and the dial positions do not form an overall sound quality score. Tonal emphasis, transient response and soundstage primarily describe sonic character. Dynamics, separation and resolution describe character while also reflecting aspects of the ability to present sound. Consequently, the positions should not all be treated as completely equivalent stylistic choices, nor should a sound or product be judged as better or worse from a single dimension. The system assigns no overall score. Final judgments require the complete profile, the actual use case and the listener’s needs.
Recording and mixing choices, the playback system, level, environment, conditions of use and individual listening experience all affect the final impression. With headphones, ear tips, the acoustic seal and individual ear-canal anatomy introduce further variation. The Sound Dashboard establishes a shared reference without erasing differences between sounds, products or listeners. A straightforward way to read it is to start with tonal emphasis, then consider how the sound rises and falls, extends through space, keeps sounds organized and reveals information. Finally, relate the profile back to the actual sound and use case.
What this system aims to achieve
The system’s primary purpose is to establish a shared language of sound. It supports discussion of requirements during sound creation and tuning, the definition and comparison of audio products, and the recording and expression of users’ listening impressions. It also helps recording engineers, live sound engineers, product developers and consumers reduce ambiguity when discussing sound. Headphones are a particularly important application: their sound depends strongly on human perception and is difficult to capture fully in a single curve, making a six-dimension profile especially useful.
Our aim is for people to understand the tonal emphasis, soft-to-loud contrast, response speed, spatial extent, distinction between sounds and presentation of information in a passage of sound, a processing result or a playback product through a simple six-dimension diagram. They should not need to learn to read complex measurement data first or rely entirely on ambiguous adjectives. Headphone listeners can compare a sonic profile with their own music, tasks and preferences. In sound creation, product definition and discussions of requirements, everyone involved can use the same structure to explain more clearly what sound they want and what they currently hear. With consistent calibration and presentation rules, the system offers more consistent, intuitive and comparable descriptions of subjective listening impressions, supplementing information that a single frequency response curve does not directly convey.

Leave a comment
This site is protected by hCaptcha and the hCaptcha Privacy Policy and Terms of Service apply.